- HOME
- Research
- Present Works
- Determining responses of chemical reaction systems from structure of networks
Present Works
Determining responses of chemical reaction systems from structure of networks
In living cells, chemical reactions are connected and form complex network systems, e.g. metabolic network. One experimental approach to study such network systems is sensitivity analysis where the amount or activity of the enzymes is perturbed and responses (concentrations of chemicals or fluxes in the system) are measured. However, due to the complexity of the systems, it has been unclear how the network structures influence the responses of the systems.
We developed a mathematical method, named structural sensitivity analysis, to determine responses of chemical reaction systems to the perturbation of the enzyme amount/activity based only on network structure. From analyses we found that (1) qualitative responses at a steady state are determined from topological information of network only. We also found that (2) response patterns, e.g., distribution of nonzero responses of chemical concentrations in the network, exhibit two characteristic features, localization and hierarchy, depending on the structure of networks and position of perturbed reactions. Finally, we found (3) a general law which directly connects the network topology and the response patterns, and governs the characteristic patterns of responses.
Suppose a subnetwork of a reaction network satisfy the following equation:
(#. chemical sp.) – (#. reactions) + (#. cycles) = 0
then the subnetwork is called “buffering structure”. Any perturbation of reactions in a buffering structure does not change the concentrations and the fluxes outside of the buffering structure, namely, the perturbation effect is localized in the structure itself.
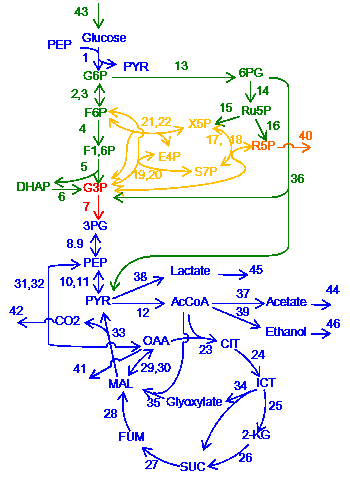
This results imply that network topology is an origin of biological adaptation and robustness. This theorem, which we call the law of localization, is not only theoretically important, but also practically useful for examining real biological systems. We apply our method to several hypothetical and real life chemical reaction networks, including the metabolic network of the E. coli metabolic network.


